Abstract
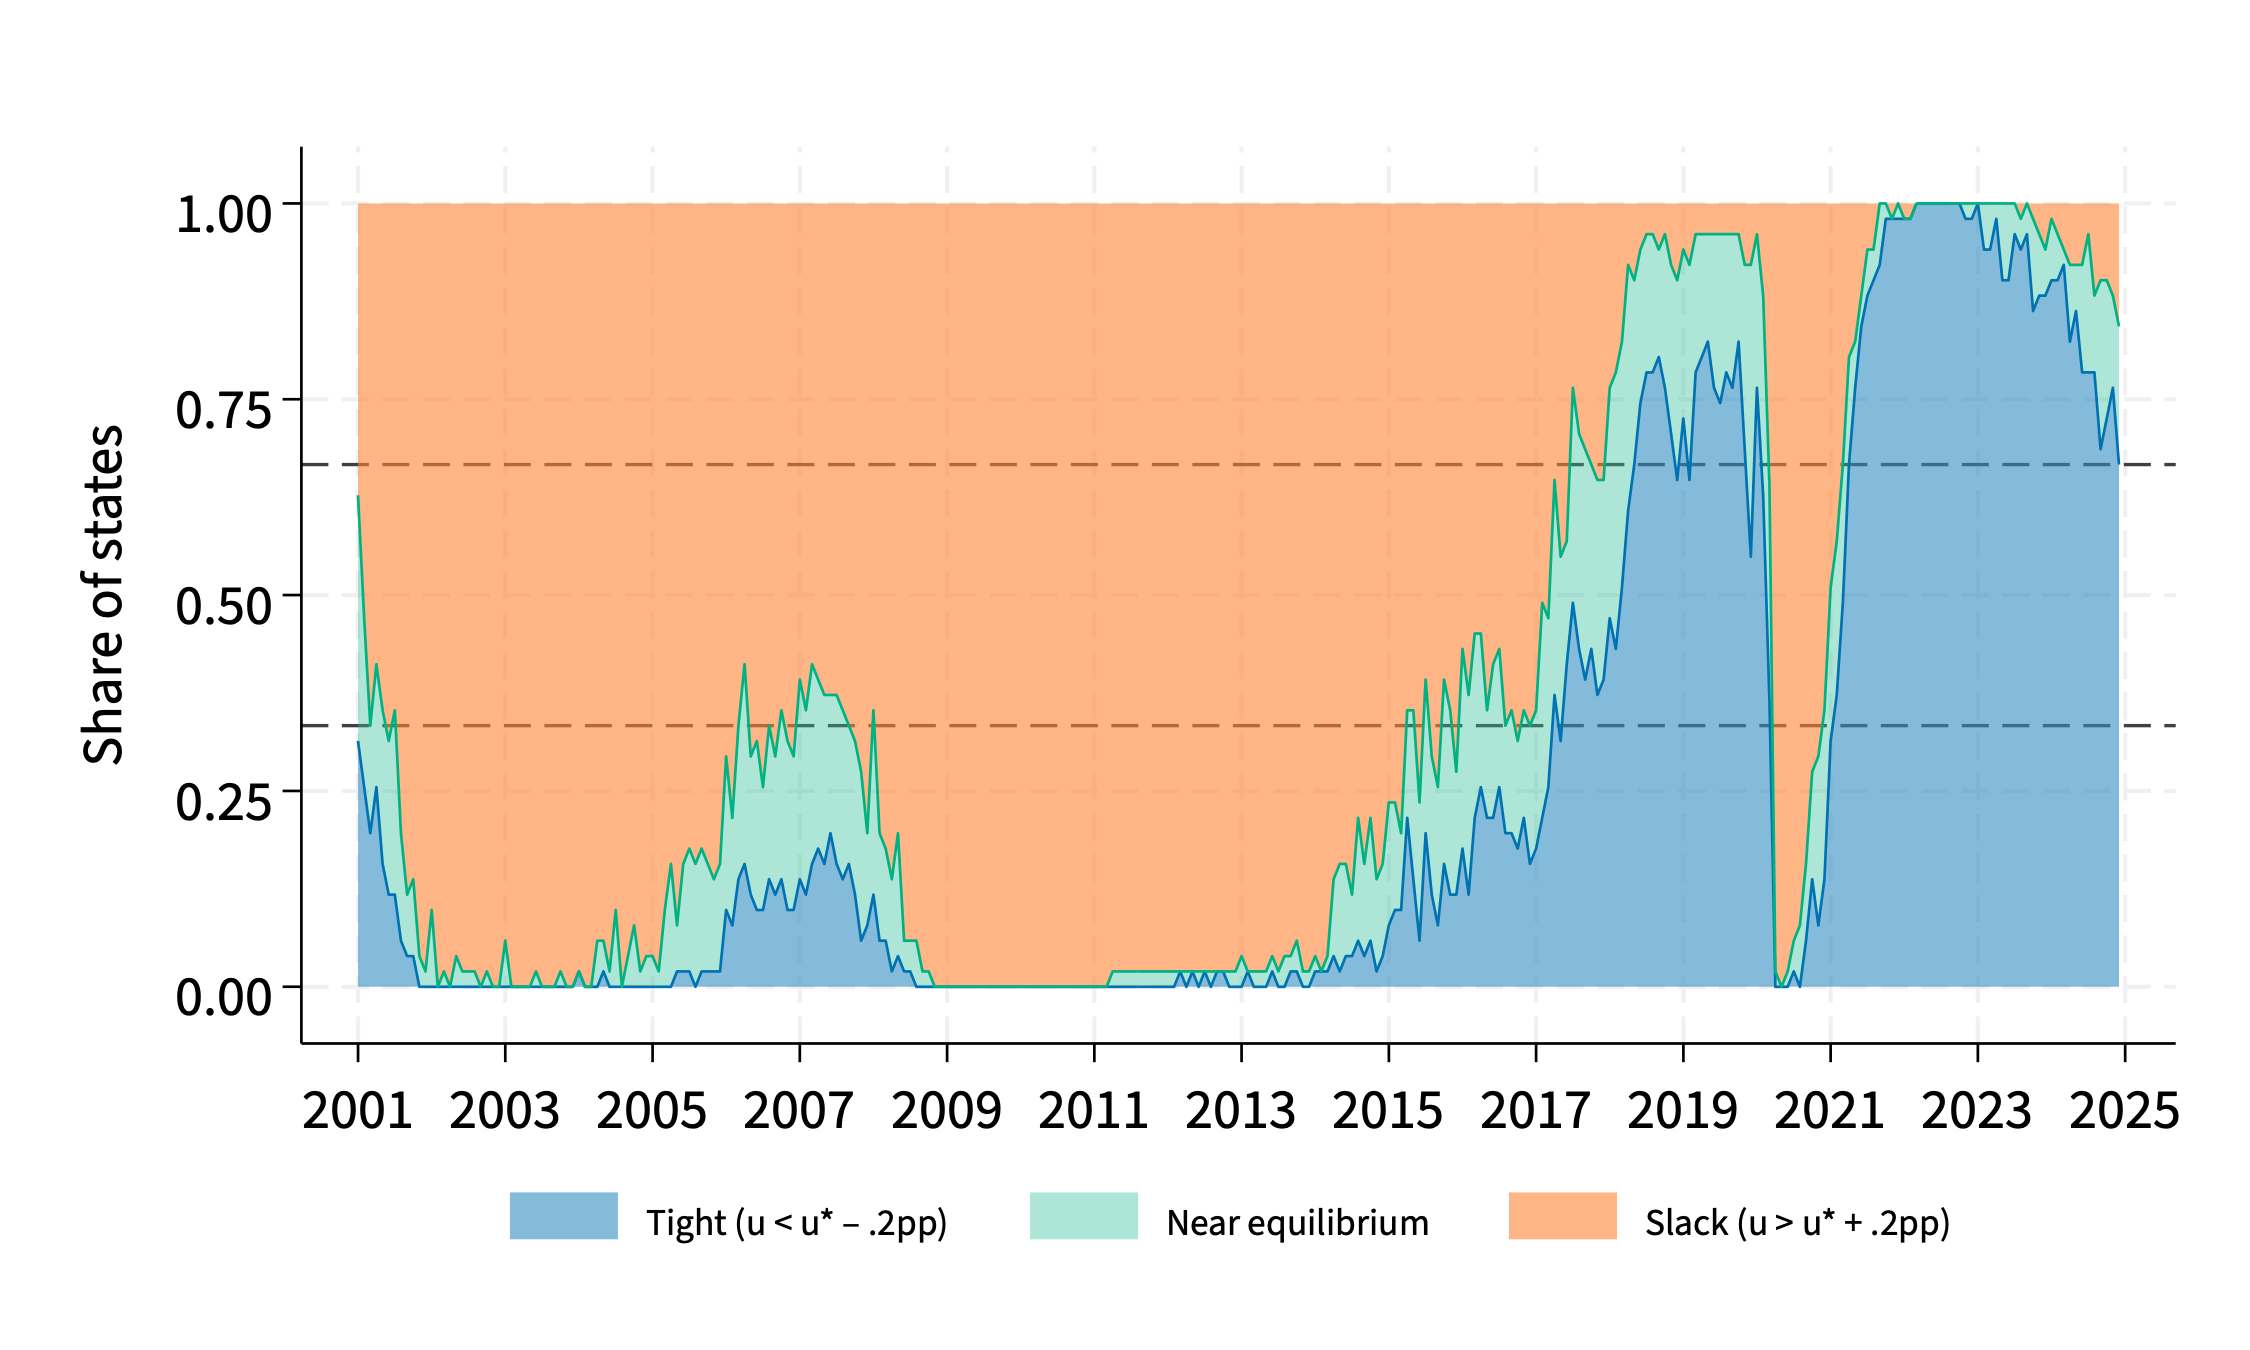
This paper constructs a monthly panel of state-level full-employment unemployment rates (u*) for the United States, covering all 50 states and the District of Columbia from 2001 to 2024. Defining u* as the geometric mean of state unemployment and vacancy rates, I document large and persistent cross-state heterogeneity. Mean u* differs by more than two percentage points between the states with the lowest and highest values. Cross-state dispersion widens over time and exhibits distinct shock dynamics: COVID-19 produces a sharp spike that largely dissipates, while the Great Recession generates a gradual increase that persists. Beveridge curves shift outward in every state between 2001–2007 and 2021–2024, but shift magnitudes vary sixfold across states. Consistent with this, mixed conditions, where some states are tight and others are slack, occur in roughly 20 percent of sample months and are concentrated during recoveries, when policy choices are most consequential. A single national full-employment benchmark therefore obscures economically meaningful regional variation relevant for policy assessment.
Figure 1: Average u* by State, 2001–2024
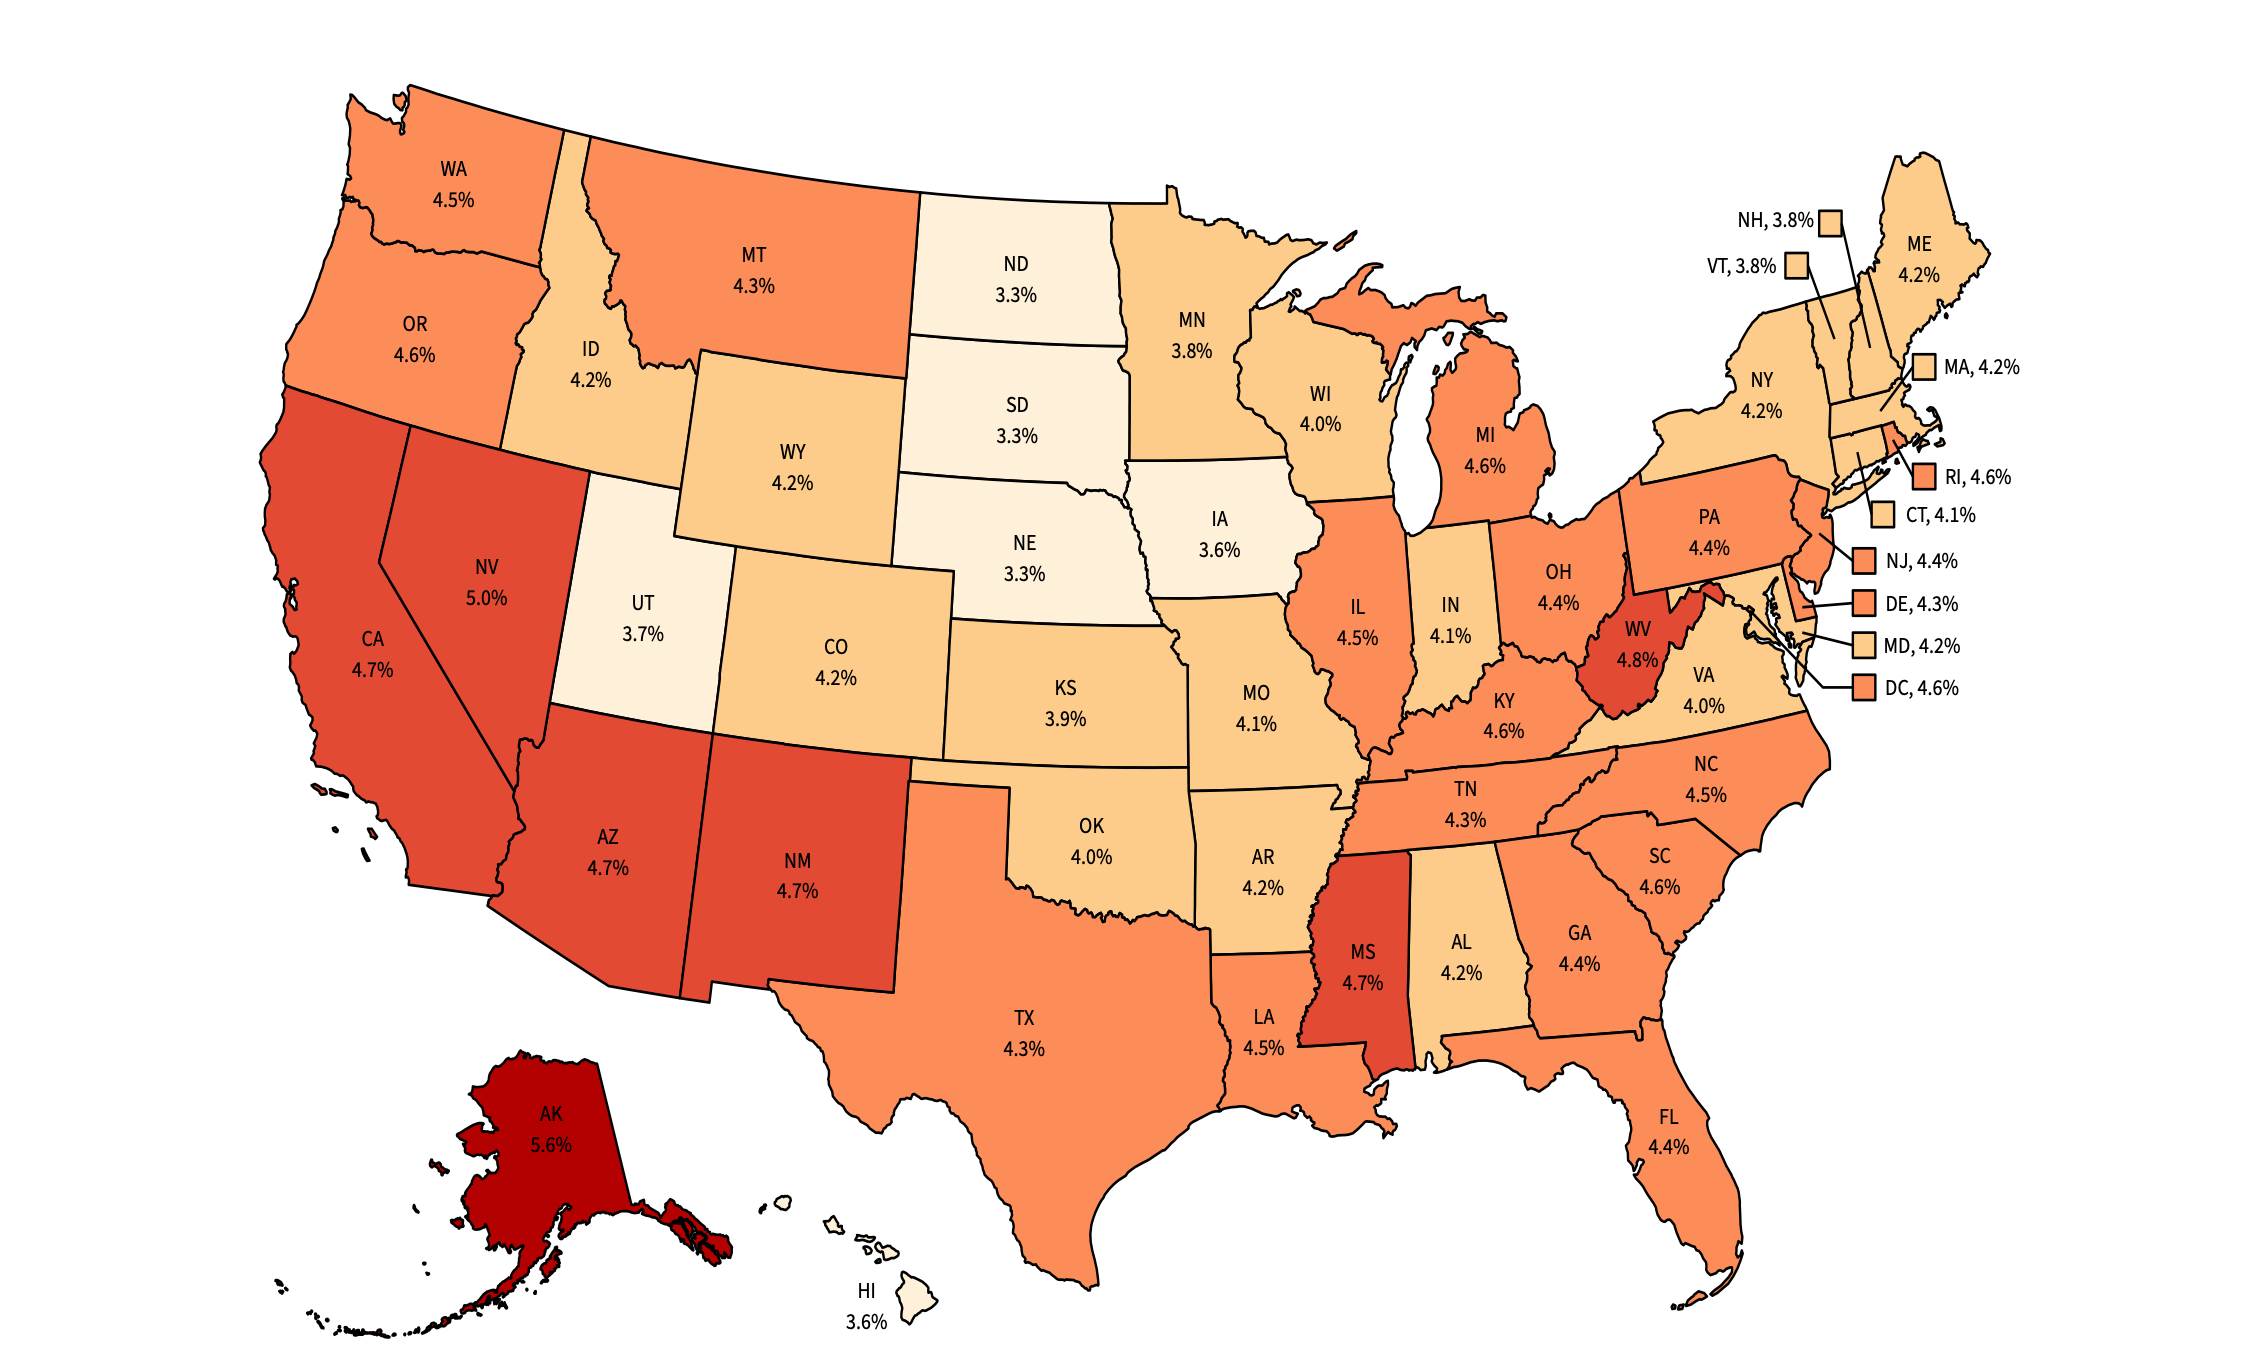
Figure 2: State Full-Employment u*: Level and Dispersion
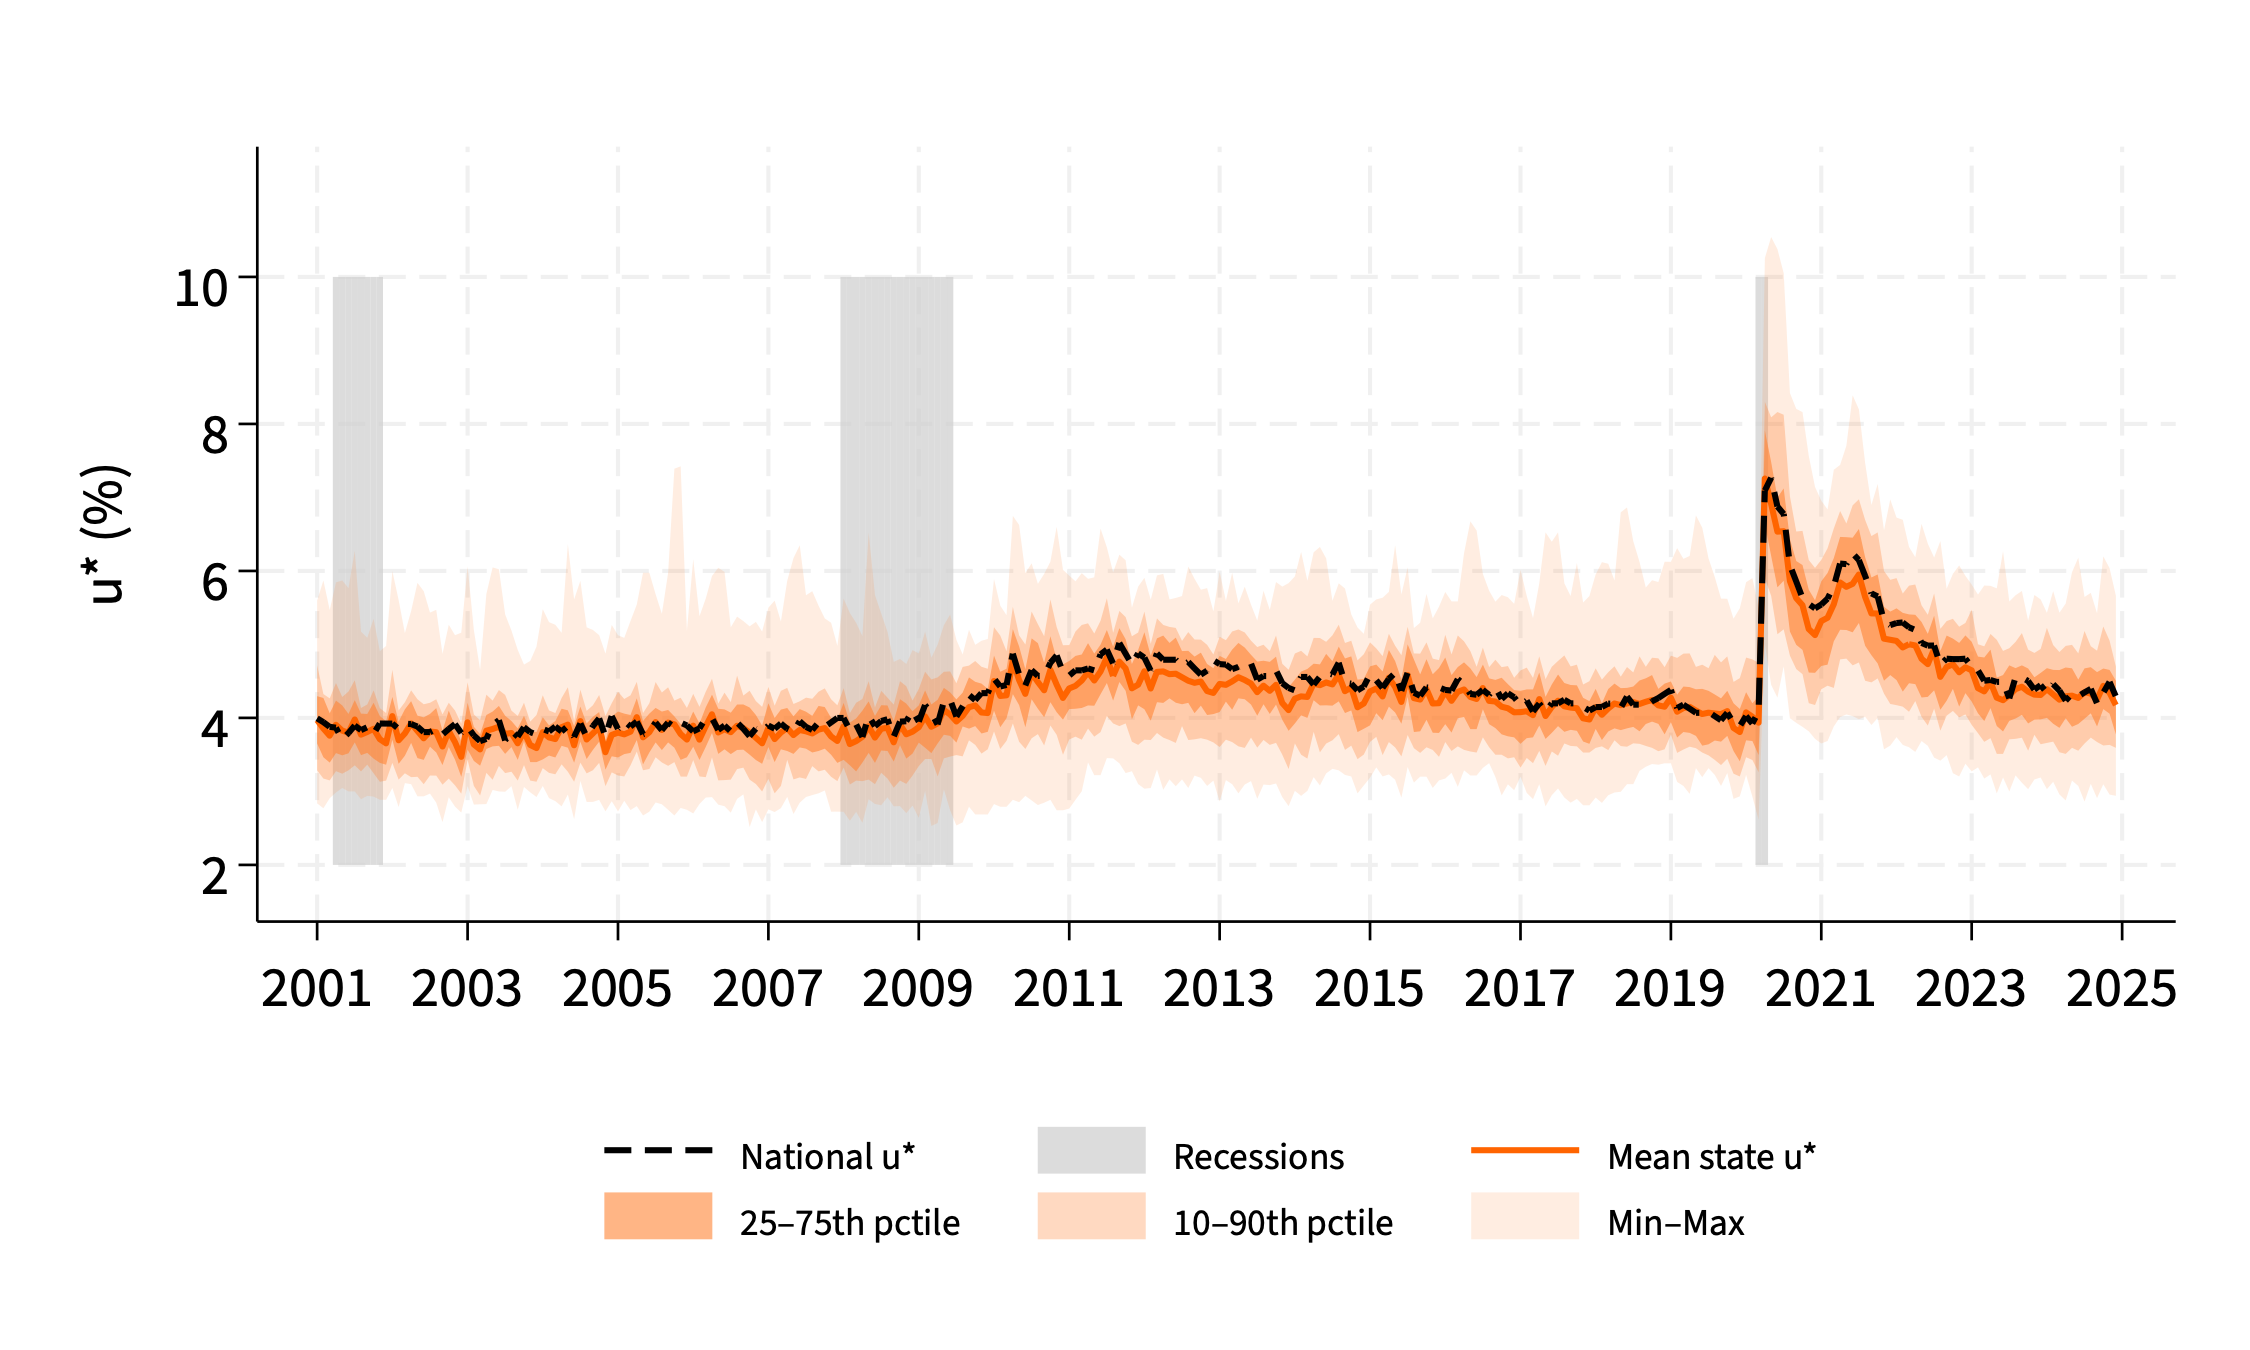
Figure 7: Share of States: Tight vs Slack Labor Markets
Citation
Pusateri, Nicholas R. 2026. “Unveiling u*: A State-level Approach” Working Paper. URL: https://nicpusateri.com/unveiling.
@article{pusateri2026unveiling,
  title={Unveiling $u^\ast$: A State-level Approach},
  author={Pusateri, Nicholas R.},
  journal={Working Paper},
  year={2026},
  url={https://nicpusateri.com/unveiling},
  }